Welcome to SC-HGSOC!
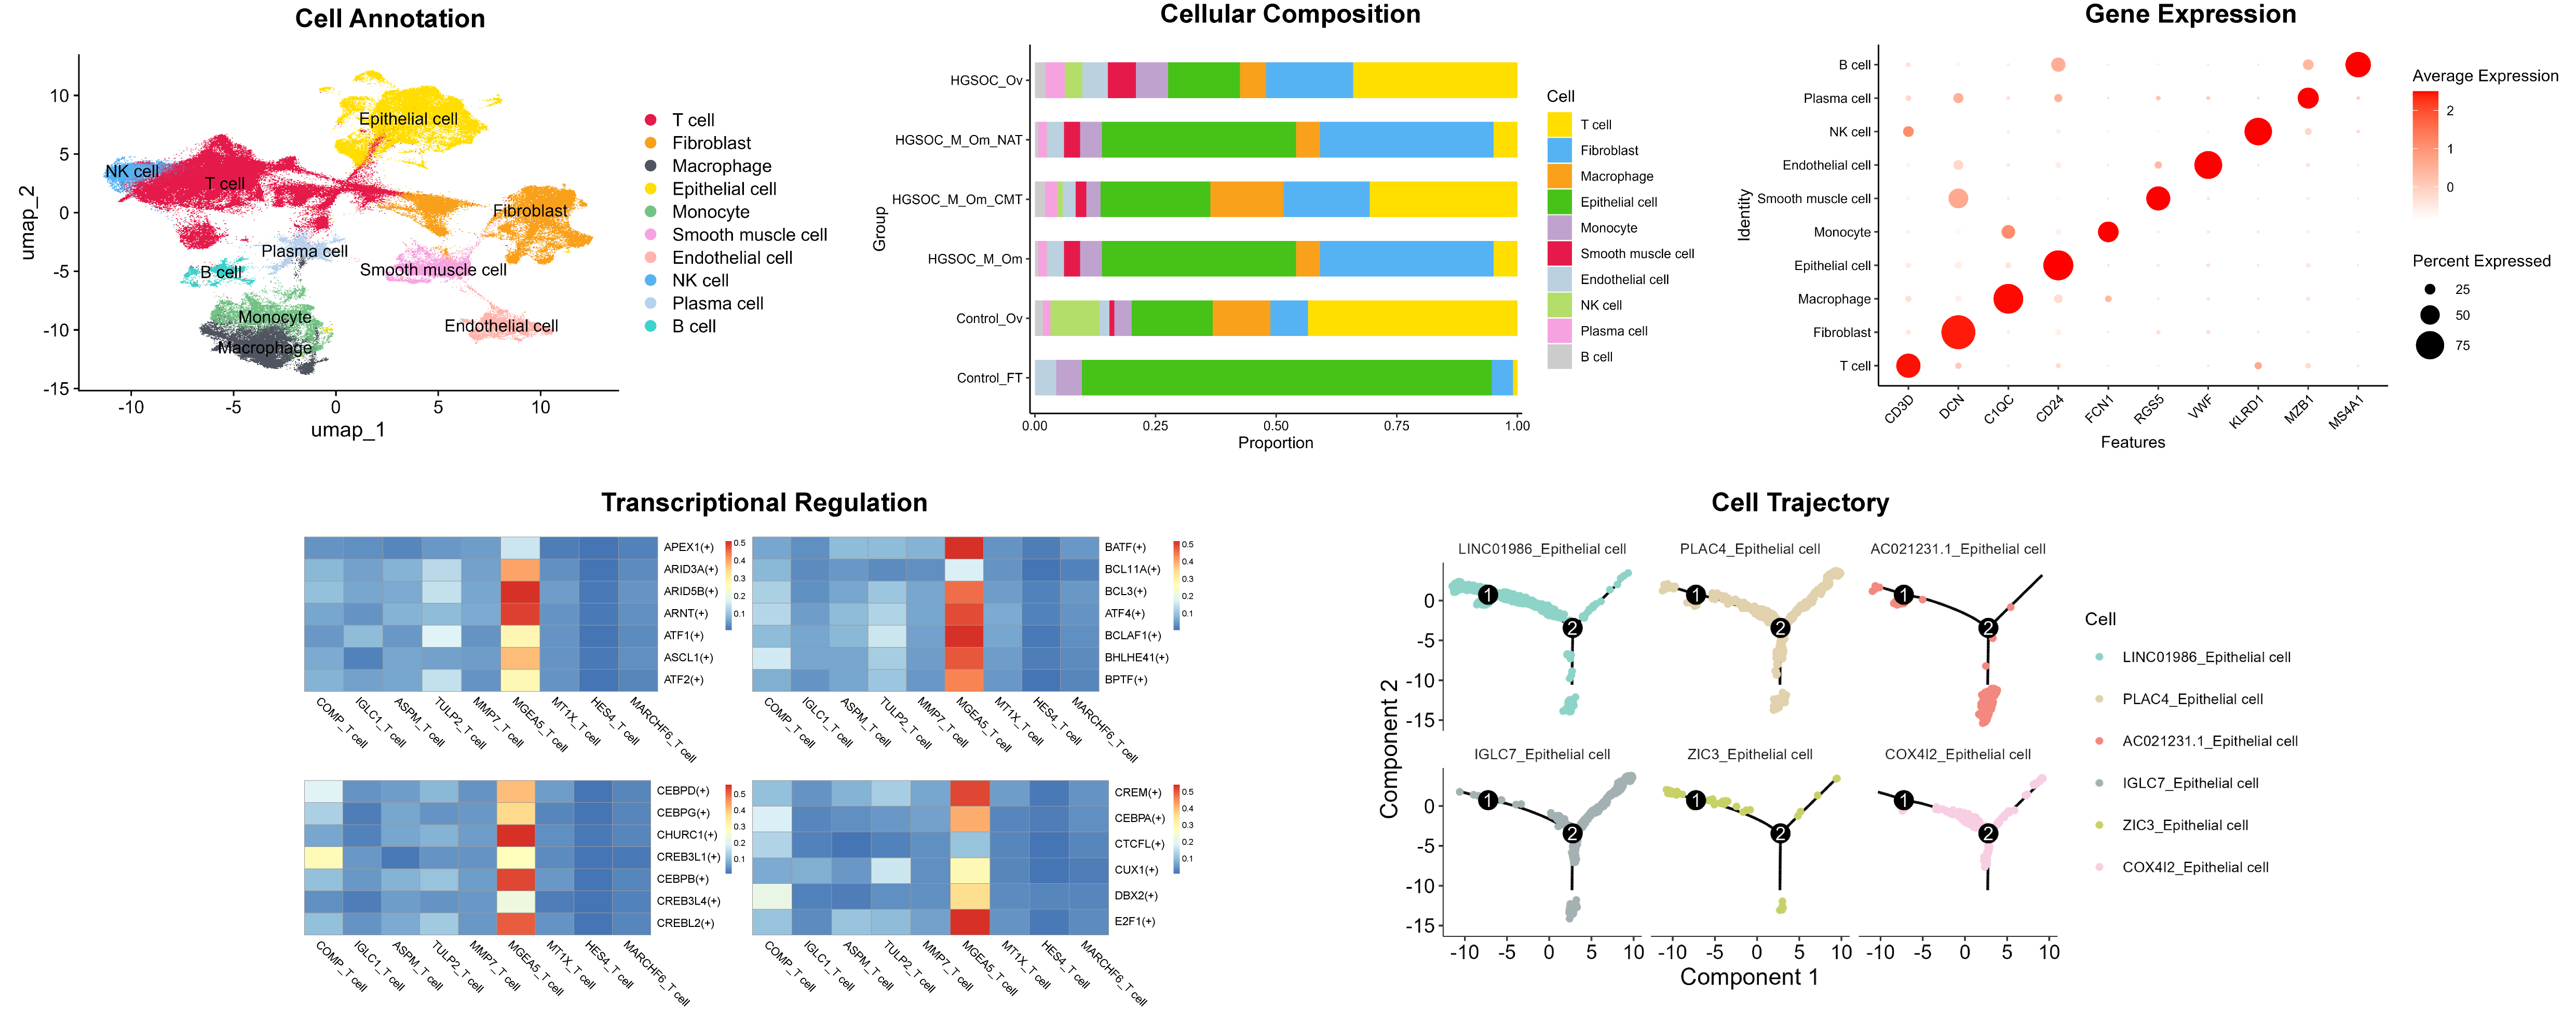
High-grade serous ovarian carcinoma (HGSOC) is the subtype of ovarian cancer with the worst prognosis, and its development involves the dynamic interplay of genetic variants and microenvironmental remodelling. The large-scale single-cell transcriptomic data generated in recent years urgently require standardised processing and integration methods to improve research accessibility. Therefore, we have developed a comprehensive repository "SC-HGSOC" that integrates 200,000 single-cell data from control, primary, metastatic and different treatment stages and identifies 10 major cell types through systematic annotation. The platform integrates four interactive analysis modules: (1) gene expression visualisation; (2) cell composition analysis; (3) transcriptional regulation analysis; and (4) cell trajectory analysis. Using the interactive visualisation interface, researchers can dynamically analyse key molecular events in the development of HGSOC, providing data to support the development of new targeted therapeutic strategies and the optimisation of individualised clinical protocols.
Overview of SC-HGSOC annotations and analyses
Mailing address
West China Second University Hospital, Sichuan University
No.20, Section 3, Renmin Nanlu, Chengdu, Sichuan
P.R. China
All rights reserved. Unauthorized use of automated methods for scraping, reverse engineering, or algorithm development is prohibited.
The system-generated results do not constitute professionaladvice and are for reference only.
Cell Annotation Analysis
Welcome to the Cell Annotation Analysis interface, where you can use the single - cell data to create UMAP plots. Please set the parameters and click the Run button for the first run.
Parameter Setting
Plot Saving
The system-generated results do not constitute professional advice and are for reference only.
Cellular Composition Analysis
Welcome to the Cellular Composition Analysis interface, where you can explore and visualise the differences in the proportions of single cells in different population cohorts or datasets. Please set the parameters and click the Run button for the first run.
Parameter Setting
Plot Saving
The system-generated results do not constitute professional advice and are for reference only.
Gene Expression Analysis
Welcome to the Gene Expression Analysis interface, where you can explore and visualise differences in gene expression levels across different population cohorts or cell types. Please set the parameters and click the Run button for the first run.
Select Data
Select Cell Grouping
Plotting Parameter
Plot Saving
The system-generated results do not constitute professional advice and are for reference only.
Transcriptional Regulation Analysis
Welcome to the Transcriptional Regulation Analysis interface, where you can explore and visualise the differences in regulon specificity between different cell types in normal and HGSOC patient ovaries. Please set the parameters and click the Run button for the first run.
Select Data
Plotting Parameter
Color Parameter
Plot Saving
The system-generated results do not constitute professional advice and are for reference only.
Cell Trajectory Analysis
Welcome to the Cell Trajectory Analysis interface, where you can explore and visualise the differentiation and developmental trajectories of different cell subpopulations in different population cohorts, as well as the associated gene changes over pseudotime. Please set the parameters and click the Run button for the first run.
Select Data
Plotting Parameter
Color Parameter
Plot Saving
The system-generated results do not constitute professional advice and are for reference only.
Single-cell Dataset Information of HGSOC
List of Abbreviations
The system-generated results do not constitute professional advice and are for reference only.
Contact Details
Scientific Problems
We welcome any suggestions regarding how to improve our database, please feel free to contact us with feedback.
Please contact yi ke: 82293711@qq.com
Technical Problems
If you have any questions about the usage of website and the interpretation of results, or encounter problems when using website.
Please contact yi ke: 82293711@qq.com
Address
West China Second University Hospital, Sichuan University
Chengdu, China
Tel: 86-028-85501633
The system-generated results do not constitute professional advice and are for reference only.